
Focus on what you should be measuring so you can streamline your PR measurement tracking Target audience: Nonprofits, cause organizations, foundations, NGOs, social enterprises When it comes to the latest in PR measurement, the mere thought of it may make you feel like it’s impossible to “keep up.” Before you overwhelm yourself, take a deep breath […]
Metrics
4 Facebook metrics your nonprofit shouldn’t overlook
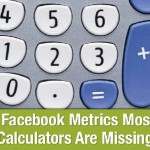
Facebook has four data points that shows you if people negatively reacted to your post. Take these factors into account when calculating the return on investment during a campaign or other social media activity.
Understanding the big changes to Facebook Insights
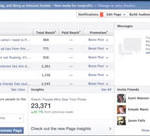
Facebook has just rolled out a new look to Facebook Insights, including some important changes to its metrics reports. In this 10-minute video we’ll step you through the changes and what they mean for your organization or nonprofit.
Infographics: Not your grandmother’s pie chart
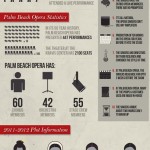
Find out why info graphics and data visualizations are helping organizations tell their stories and showcase their statistics by using colorful graphics and compelling story lines.
25 SMART social media objectives
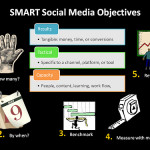
Using SMART objectives can help nonprofits chart their impact. Find out how to set SMART objectives and why this is important. Plus, check out 25 objectives for inspiration.